top of page

Customer journey mapping and UX competitive analysis:
Online bike insurance purchase
Overview
Overview
Project scope
Google wants to increase its site traffic by increasing the traffic on insurance websites which users commonly access through Google's search engine.
Impact
The research discovered 80% user drop-off points during bike insurance purchase journey. Uncovered insights through user journey mapping and competitive analysis for 4 leading insurance brands in India to make targeted design recommendations.
Activities
-
Participant recruitment
-
Discussion guide creation
-
Contextual interviews with 40 users
-
Affinity mapping
-
Insights generation
Timeline
3 months
Tools
Miro, Google sheets
Problem & Action
Reduce user drop offs from 4 leading insurance websites in India (ICICI, HDFC, Acko, Bajaj)
Problem
-
Google noticed an increased drop offs of users in India from bike insurance websites at the time of purchase
-
Google wants to understand why users are dropping off from 4 leading Indian insurance websites (ICICI, HDFC, Acko, Bajaj)
-
Further benchmark the experience on these websites with respect to each other
-
This in in turn would help increase site traffic on Google as users commonly access these sites through Google
Action
Provided insights on where and why drop offs were occurring through user journey mapping
Research goals which provided these insights:
1
What is the the user journey for bike insurance purchase in India
2
What are the good and bad experiences in the journey
3
Compare and benchmark the 4 different insurance providers and their website
4
When do customers drop off from the website and why
How did I do this?
Strategy for research
Defining Target user group
Defined Target group based on insurance buying behavior, to understand differences in journeys & experiences
Cohort 1: Novice renewal
New users who haven't renewed their insurance before

Cohort 2: Veteran renewal
Users who have renewed their insurance 1+ times under the same policy

Cohort 3: Multiple renewal
Users who have renewed their insurance 1+ times under different policies
Screener creation
Choosing a mix of cities and tiers within India to capture difference in behaviors

Summary of participant criteria
Further drilling down on user profiles; chose to keep it between age group of 18-50 as in India the market for unsupervised mobile usage over 50 is low
Interview dates, cities and tiers
Chose a mix of cities and tiers to see if insights uncovered would vary/remain the same
40
Male
Female
18-25 years old
26-33 years old
34-50 years old
SEC A
SEC B
SEC C
40
Discussion guide creation
Wrote sections goals based on a broad user journey while purchasing insurance
Are users interested in conducting research before purchasing bike insurance?
If yes, how and why do they conduct research?
Awareness
What kind of research do users conduct?
What factors do they consider before entering a brand and policy?
Research
Is the website matching user's needs?
What are the good and bad parts? Where and when do they drop off?
Purchase
What are user's expectations in this stage?
What would motivate users to renew with the same brand?
Usage
Complete discussion guide with the section goals, questions and probes pertaining to these goals

Reseach strategy
Understanding my users
Primary research
Interviews
Conducted 1:1 interviews through cognitive walkthrough to understand natural user journey


Details of interviews conducted
-
1:1 cognitive walkthroughs with 40 participants; 2 users of each brand (ICIC, HDFC, Acko, Bajaj)
-
1.5 hour duration
-
Virtual zoom sessions
Snapshot of note guide
-
Different tabs for each section to help in ease of navigation
-
Questions arranged vertically with answer cells for each participant to help in clear demarcation of all data
-
Color coding of quotes, important takeaways and incorrect interpretation to aid in analysis
Analysis of user stories
First-level analysis
Mapped out entire journey for each participant to understand individual drop offs, good and bad experiences
Below image is the user journey of 1 participant for 1 brand
There were a total of 9-10 takeaways. This an
example of 1 participant-level takeaway post
journey mapping
P1 was skeptical of the catchphrase 'Get insurance for Rs.499' on the homepage, as it doesn't align with their real life experience wrt insurance pricing

Second-level analysis
Affinity mapped journeys across participants and brands to understand brand-level drop offs, good and bad experiences
This below image is the user journey of all participants across 1 brand
There were a total of 9-10 insights through this analysis. This is an example of 1 brand level insight
Most users were skeptical to enter their phone number on the homepage of the ICICI insurance website, as they had past experience of being bombarded with offers and messages

Analysis
What research findings did this lead to?
Insights
Insights
Insights based on the research goals
1
User journey for bike insurance purchase in India
Key insights
Insight 1: Most users prefer using aggregator sites for purchasing insurance, as it gives them access to quickly compare prices and benefits across different brands
Insight 2: Veteran renewal users click on the renewal link received on their cellphones to renew their plan as opposed to going to the website and scouting for new plans as it saves their time
Insight 3: Users compare IDV, Insurance benefits and Premium while making purchase decision related to bike insurance, as these three factors determine the cost to benefit of the insurance

2
Good and bad experiences in the journey
I gave insights for this research goal based on the different parts of the user journey:
-
Research
-
Website related sections: homepage, plan selection, enter details, payment
-
Usage
Each part has a minimum of 4-5 insights, here I have shown the key insights on the homepage

3
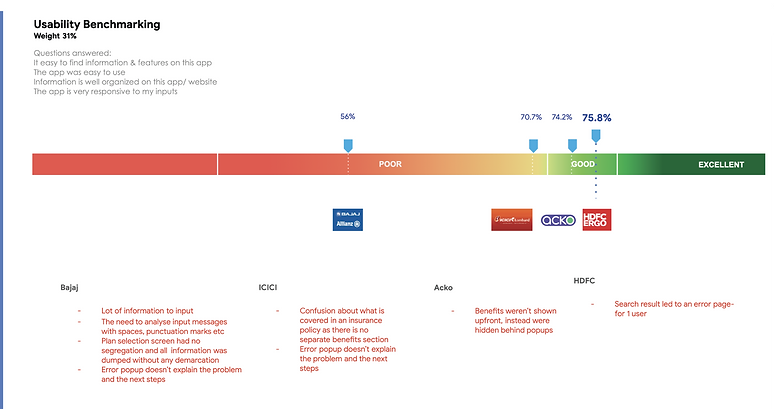
UX benchmarking of the different brands
3.1 Overall benchmarking

3.2 Benchmarking across 6 UX components: Usability, Learnability, Usefulness, Personalization, Desirability, Imersiveness
While I showcased the benchmarking of the 4 brands across the different UX components in the report, here I have shown the example of benchmarking done for Usability, which is an important component on insurance websites
4

Why and where are users dropping off
Reflecion
Reflection
This was a UX research project that I led independently, hence it taught me the entire UX research process. These are a couple of my learnings:
Ask for proofs during recruitment to avoid fake participants
Cognitive walkthroughs help in understanding unprompted user journeys the user undertakes in the real world
During primary research, you can either understand user's intention or behavior
To avoid fake participants it is important to ask for proofs which confirm participants usage of a product, their age etc (whatever is relevant to the research) during the recruitment
Eg. When a participant mentions that they don't understand something and they would like to Google to learn more about an insurance term, allow them to do it. This is what they would do in an ideal scenario, and hence it becomes an important behavioral learning for the research
While writing a discussion guide, there are primarily two data points one could obtain, understanding user’s intention and understanding user’s behavior. You frame your questions based on the kind of data you want
Other projects


bottom of page